Table of Contents
- Adoption is wide. Usage is thin.
- Most AI use is collaboration. Automation stays rare.
- Most of the value is landing at home.
- The global picture: a widening divide.
- Where the depth comes from.
The transformation was supposed to have landed by now. Budgets were signed off, licences went out across the team, and the adoption dashboards turned green. Look past the dashboards, though, and most of the working day still runs the way it did a year ago.
Google has now put hard numbers behind that gap. Its first AI & Economy ATLAS report (Activity, Task, Landscape, and Adoption Study) draws on 15 million de-identified interactions across the Gemini app, AI Mode, and the Gemini API, products used by more than a billion people every month. The dataset reaches over 150 countries, 140 languages, 800 occupations, and 4,000 tasks. It is the most detailed public measurement so far of how people actually use AI, and the picture it returns is more sober than the headlines.
Adoption is wide. Usage is thin.
Start with reach. AI now shows up in 68% of all occupations, together accounting for around 90% of US employment. That is close to saturation at the level of job categories. Then look inside the job. In a typical role, AI is used for only about 21% of tasks. The tool is present nearly everywhere and doing a fraction of the work.
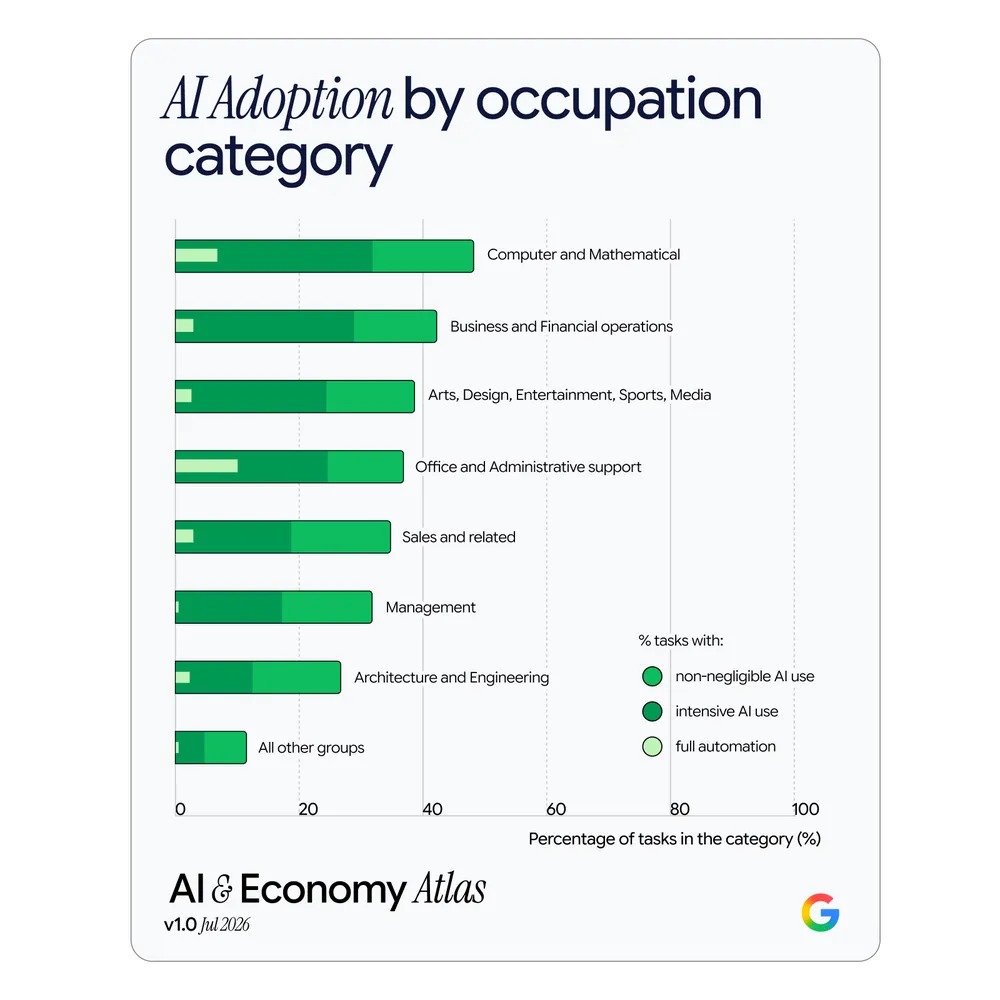
The occupation view makes the pattern plain. Even in computer and mathematical work, the most AI-heavy category in the dataset, applies AI to under half of its tasks. Every other category sits lower, and the fully automated share stays a thin band at the left of each bar.
So adoption has gone broad without going deep. That is the central tension in the report, and it is the one worth sitting with if you are responsible for the return on an AI budget.
Most AI use is collaboration. Automation stays rare.
The next question is what people do with AI once they reach for it. The answer runs against the automation narrative. In non-routine cognitive work, fewer than one in ten interactions aim to automate a task end-to-end. The dominant mode is collaborative: ideation, strategy, information retrieval, and learning on the job.
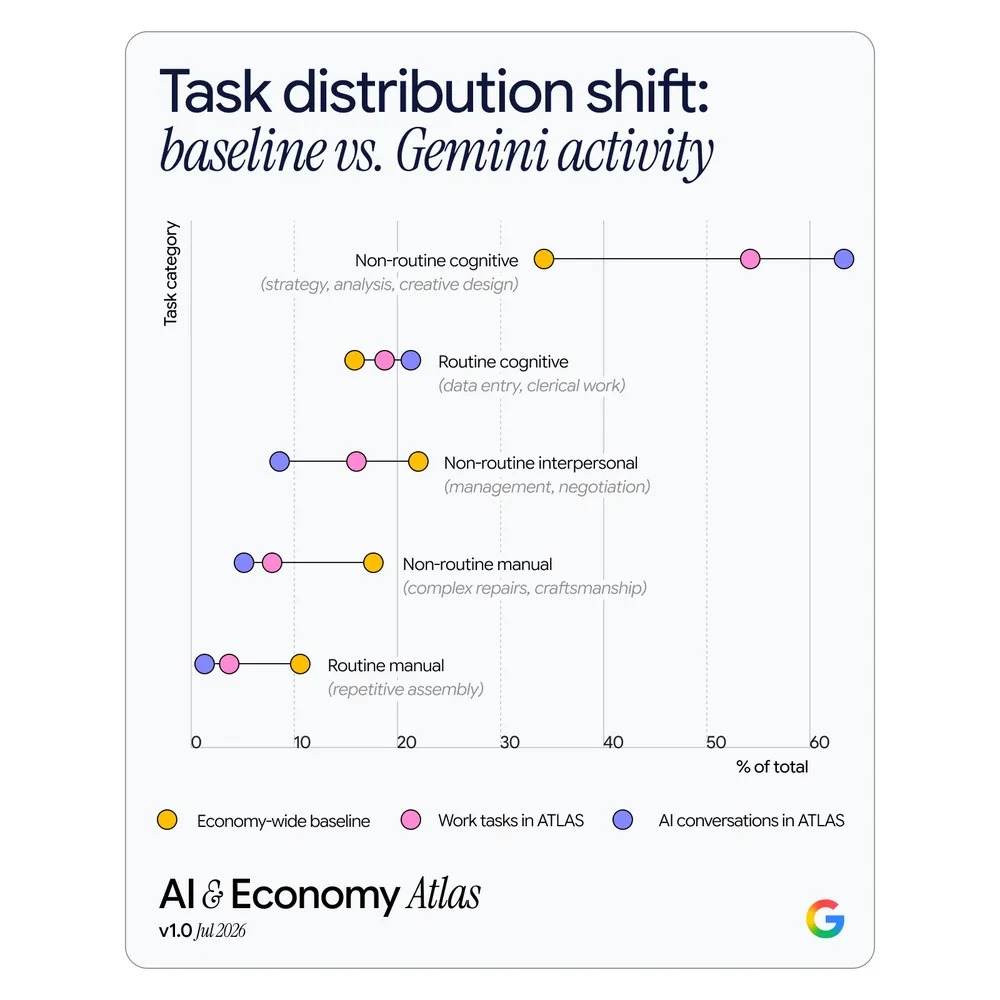
The type of work skews sharply as well. ATLAS compares three distributions:
- the economy-wide baseline of tasks
- the work tasks people bring to AI
- the AI conversations themselves
Non-routine cognitive work (strategy, analysis, creative design) makes up around a third of the economy but close to two-thirds of AI conversations. Routine manual and non-routine manual work, by contrast, all but disappear from the AI column.
There is a caveat to the manual picture, and it is an interesting one. AI use is not confined to desk work. Auto technicians and industrial mechanics are using conversational AI as a live diagnostic partner for real-time troubleshooting, and when they do, they are twice as likely to reach for multimodal tools that read images and video. The volume is lower than in knowledge work, though the direction of travel matters.
Most of the value is landing at home.
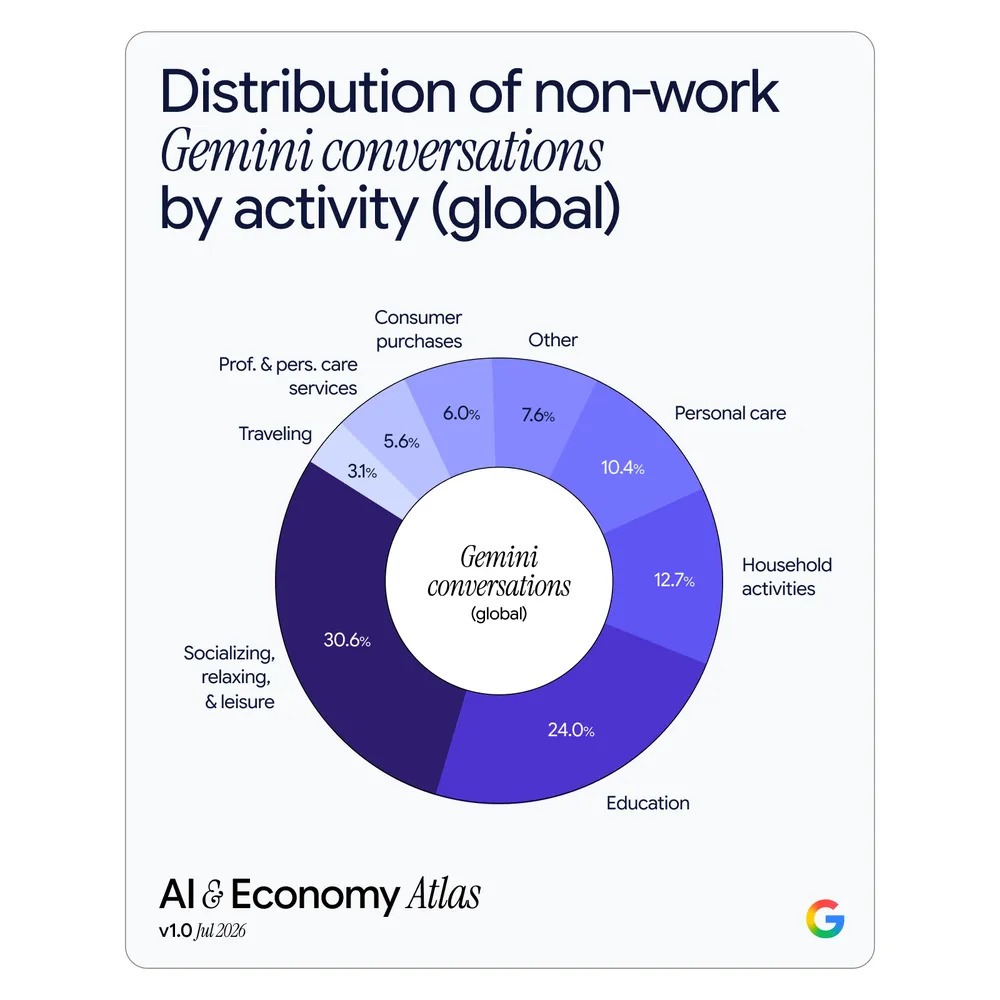
Here is the finding that standard economic statistics will struggle to capture: more than 86% of ATLAS interactions happen outside work. When Google breaks down non-work conversations, socialising and leisure lead at 30.6%, followed by education at 24.0% and household activities at 12.7%.
Inside that non-work total sits a category that should interest anyone working with public data. People are turning to AI for high-friction administrative tasks that have always been painful to navigate. Within government and civic use, licences, fines, fees, and taxes account for 40.1% of activity, ahead of civic participation at 26% and general government services at 16.5%.
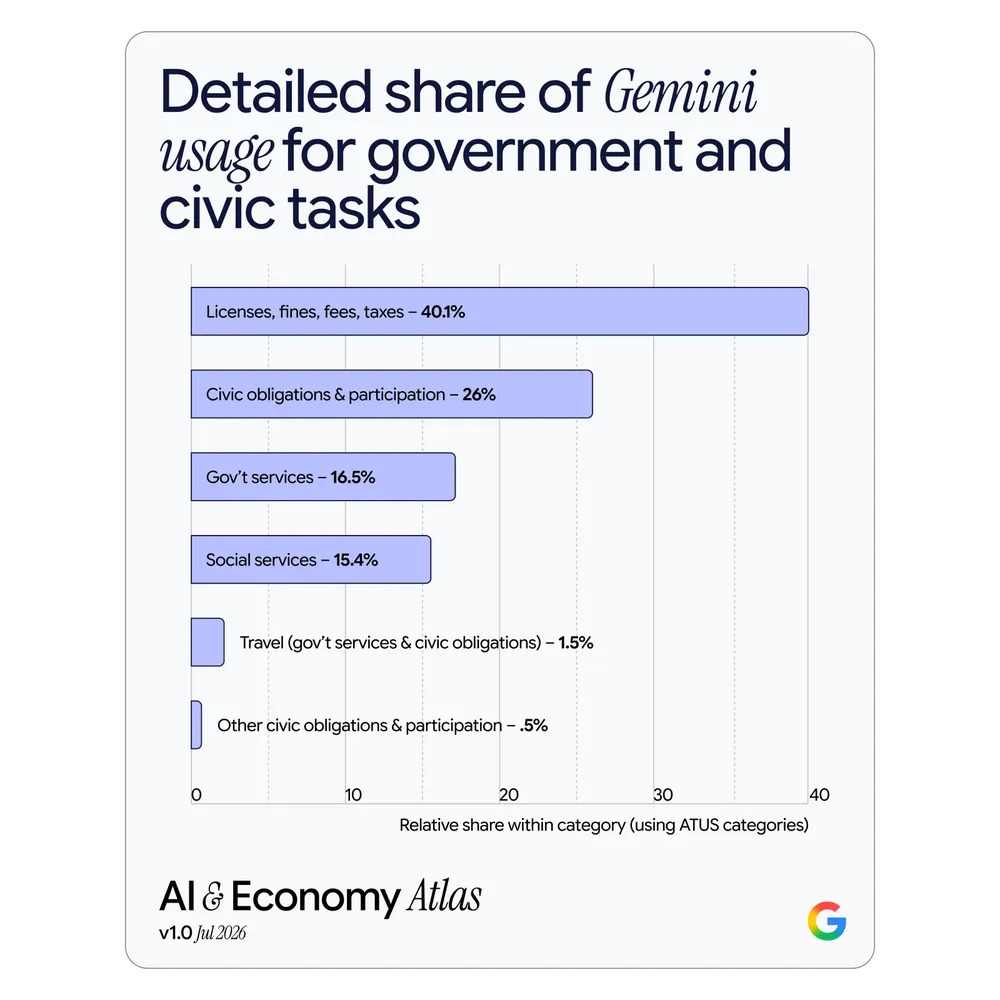
These are exactly the tasks where public information exists yet sits behind opaque interfaces and dense documentation. People are using AI as the layer that finally makes that information reachable.
The global picture: a widening divide.
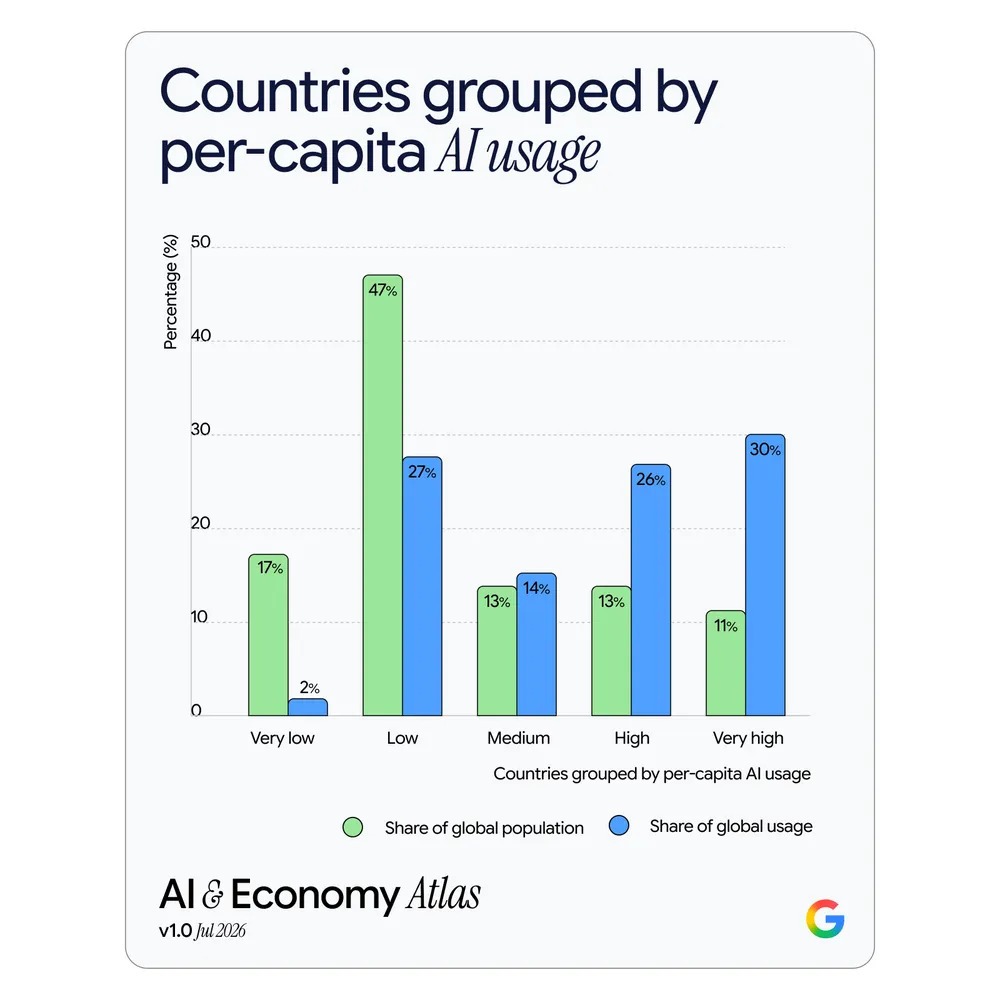
The last data point reads as a warning. AI usage has diffused to over 150 countries representing 99% of the world’s population, yet it is far from evenly spread. Grouped by per-capita usage, the lowest two tiers hold 64% of the world’s population and generate 29% of usage. The top two tiers hold 24% of the population and generate 56%. Adoption is tracking wealth, and the gap risks hardening into a fresh digital divide.
Language tells a related story. English accounts for only about a third of global AI conversations, and people do not abandon their mother tongue when a task grows demanding. For anyone building or selling AI in Europe, that sets a real design constraint. A tool that defaults to English quietly writes off most of its potential users.
Where the depth comes from.
Read together, the ATLAS numbers describe a market that has adopted AI at the surface and is waiting for something to take it deeper. Usage stalls at 21% of tasks for a structural reason. For the study, general-purpose assistants are strong on general work, so people lean on them for the generic slice of the job and fall back to older methods when the task turns specific and tied to a particular dataset.
If you would like to talk through where domain-specific AI could take your team past the shallow end, our team is happy to find a time.